Growing Crops in Aeroponic Towers
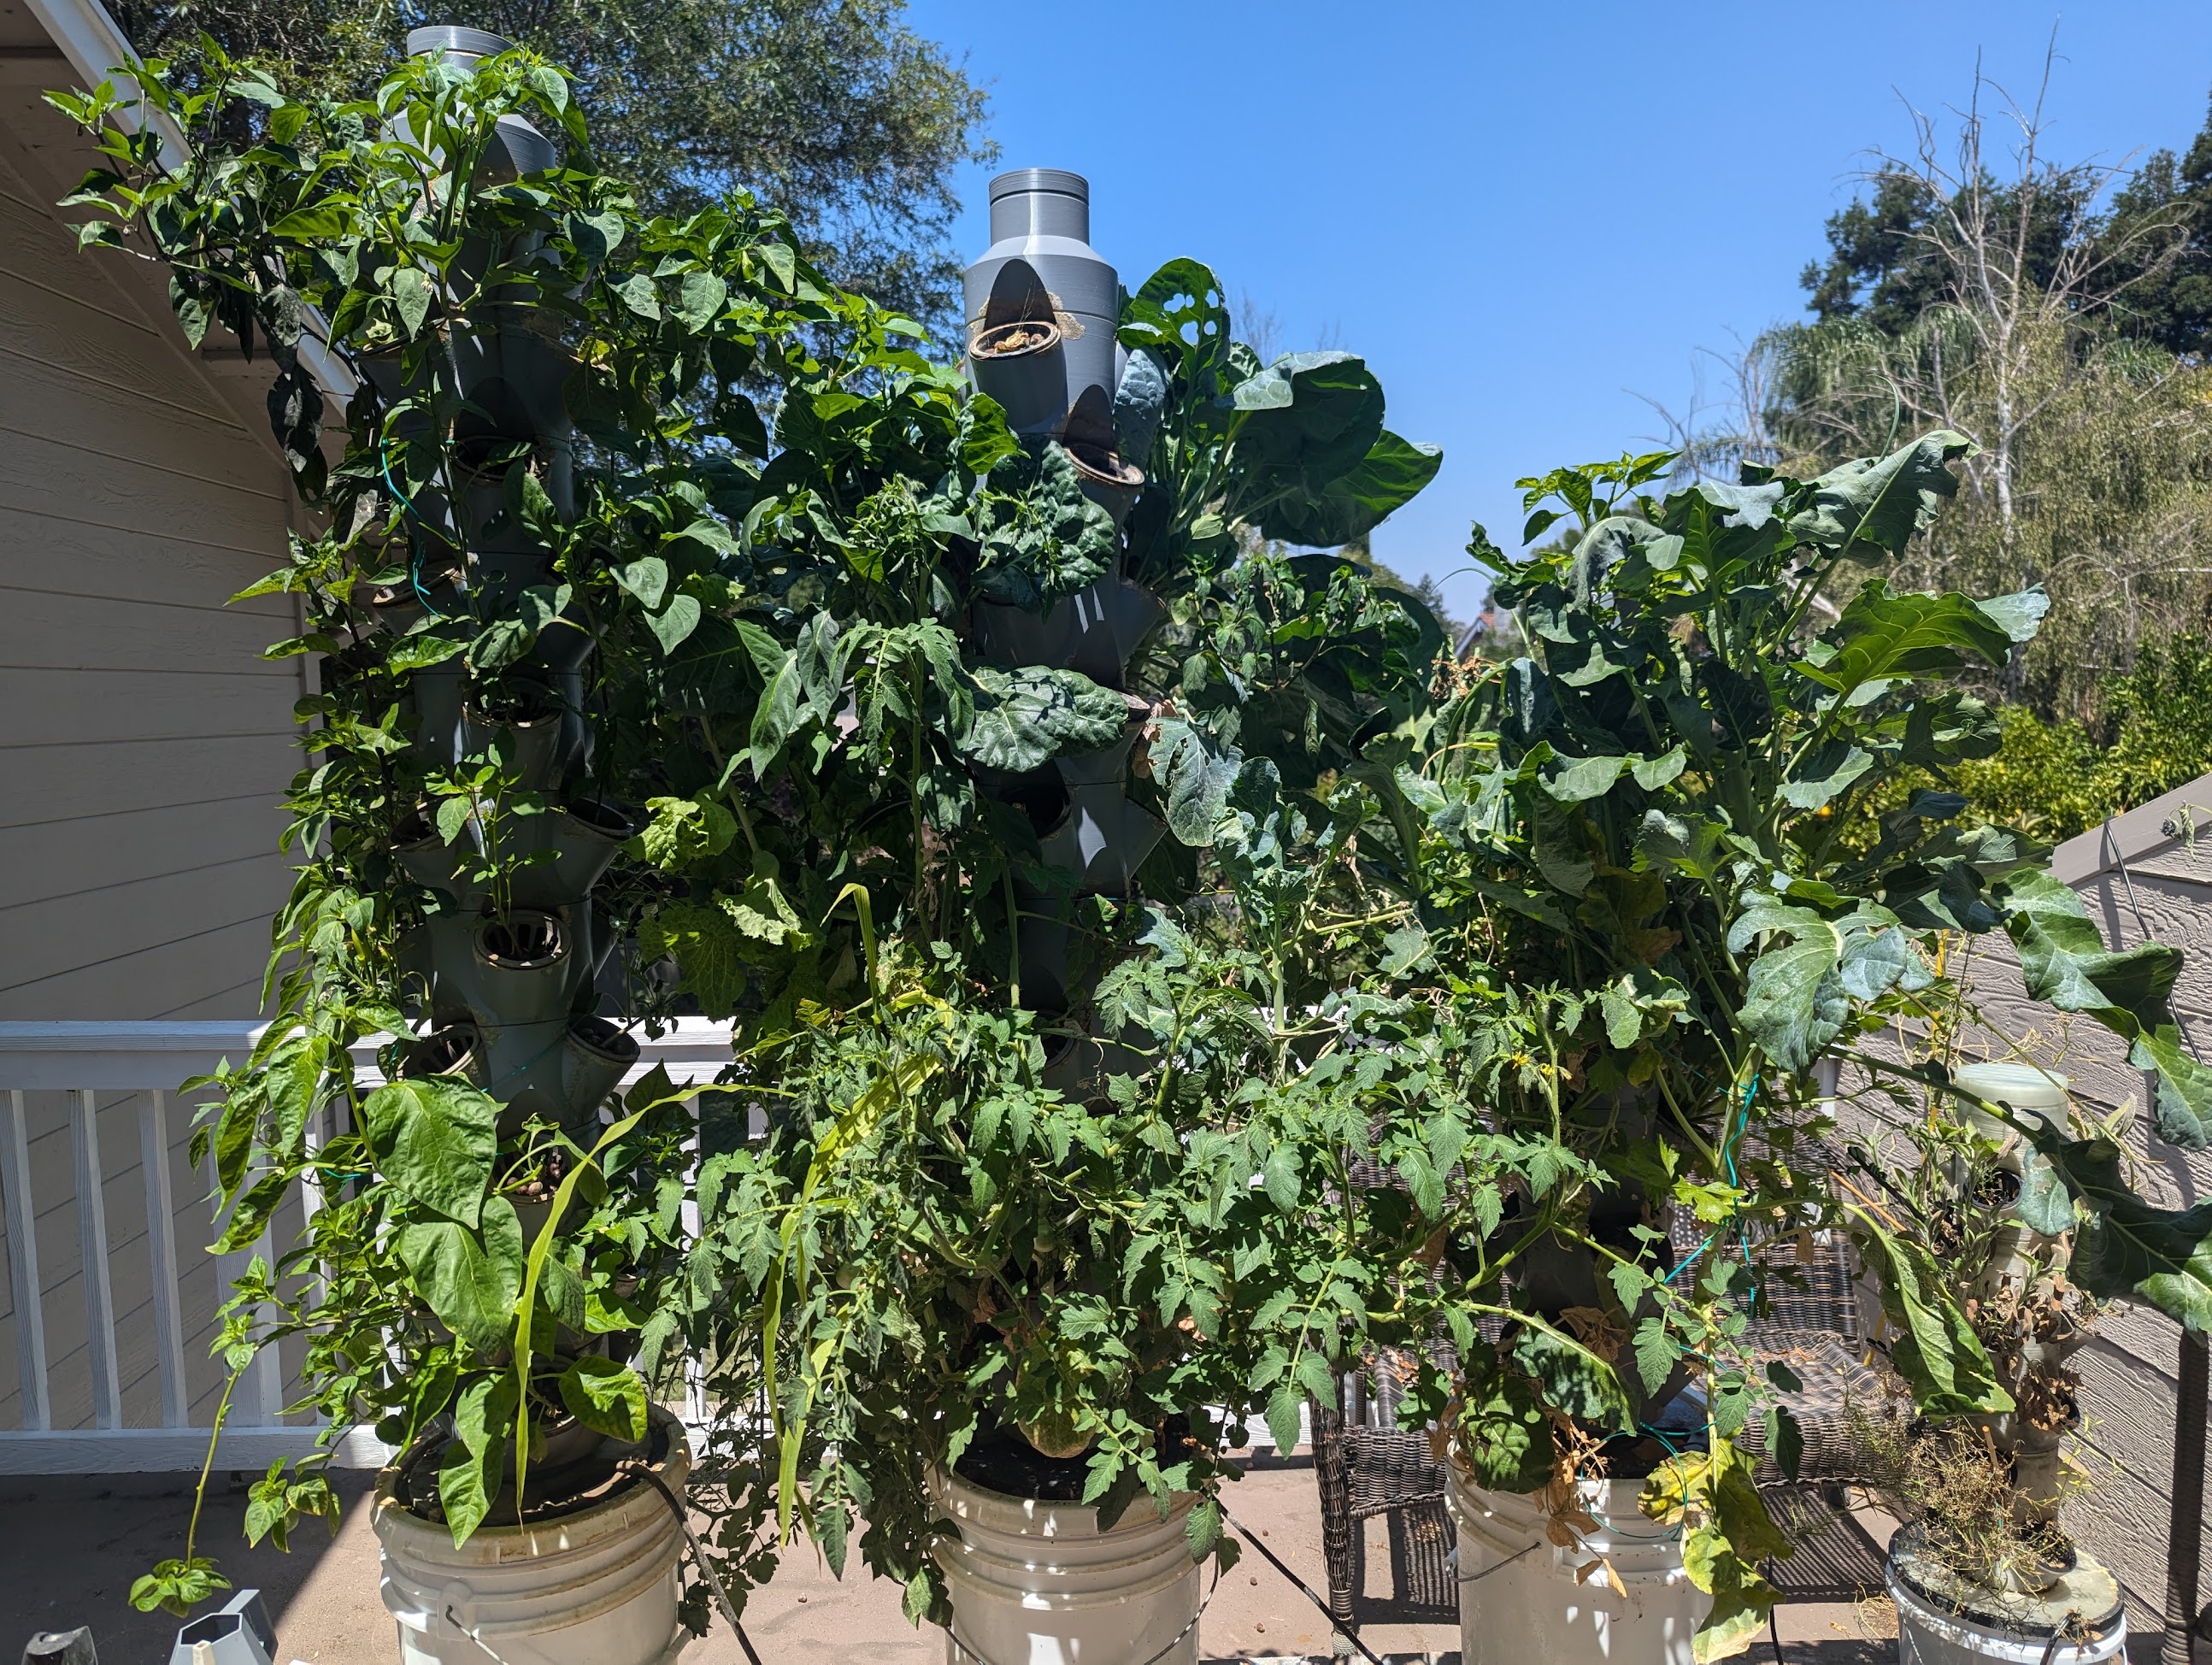
Growing your own food is awesome, but I think vertical farming is even more awesome, so I fired up my 3D printers and did a little hands-on engineering! I figured I would document how I did it in case anyone else wants to do something similar based on my work.
Hacking The Brains Out Of My Tesla
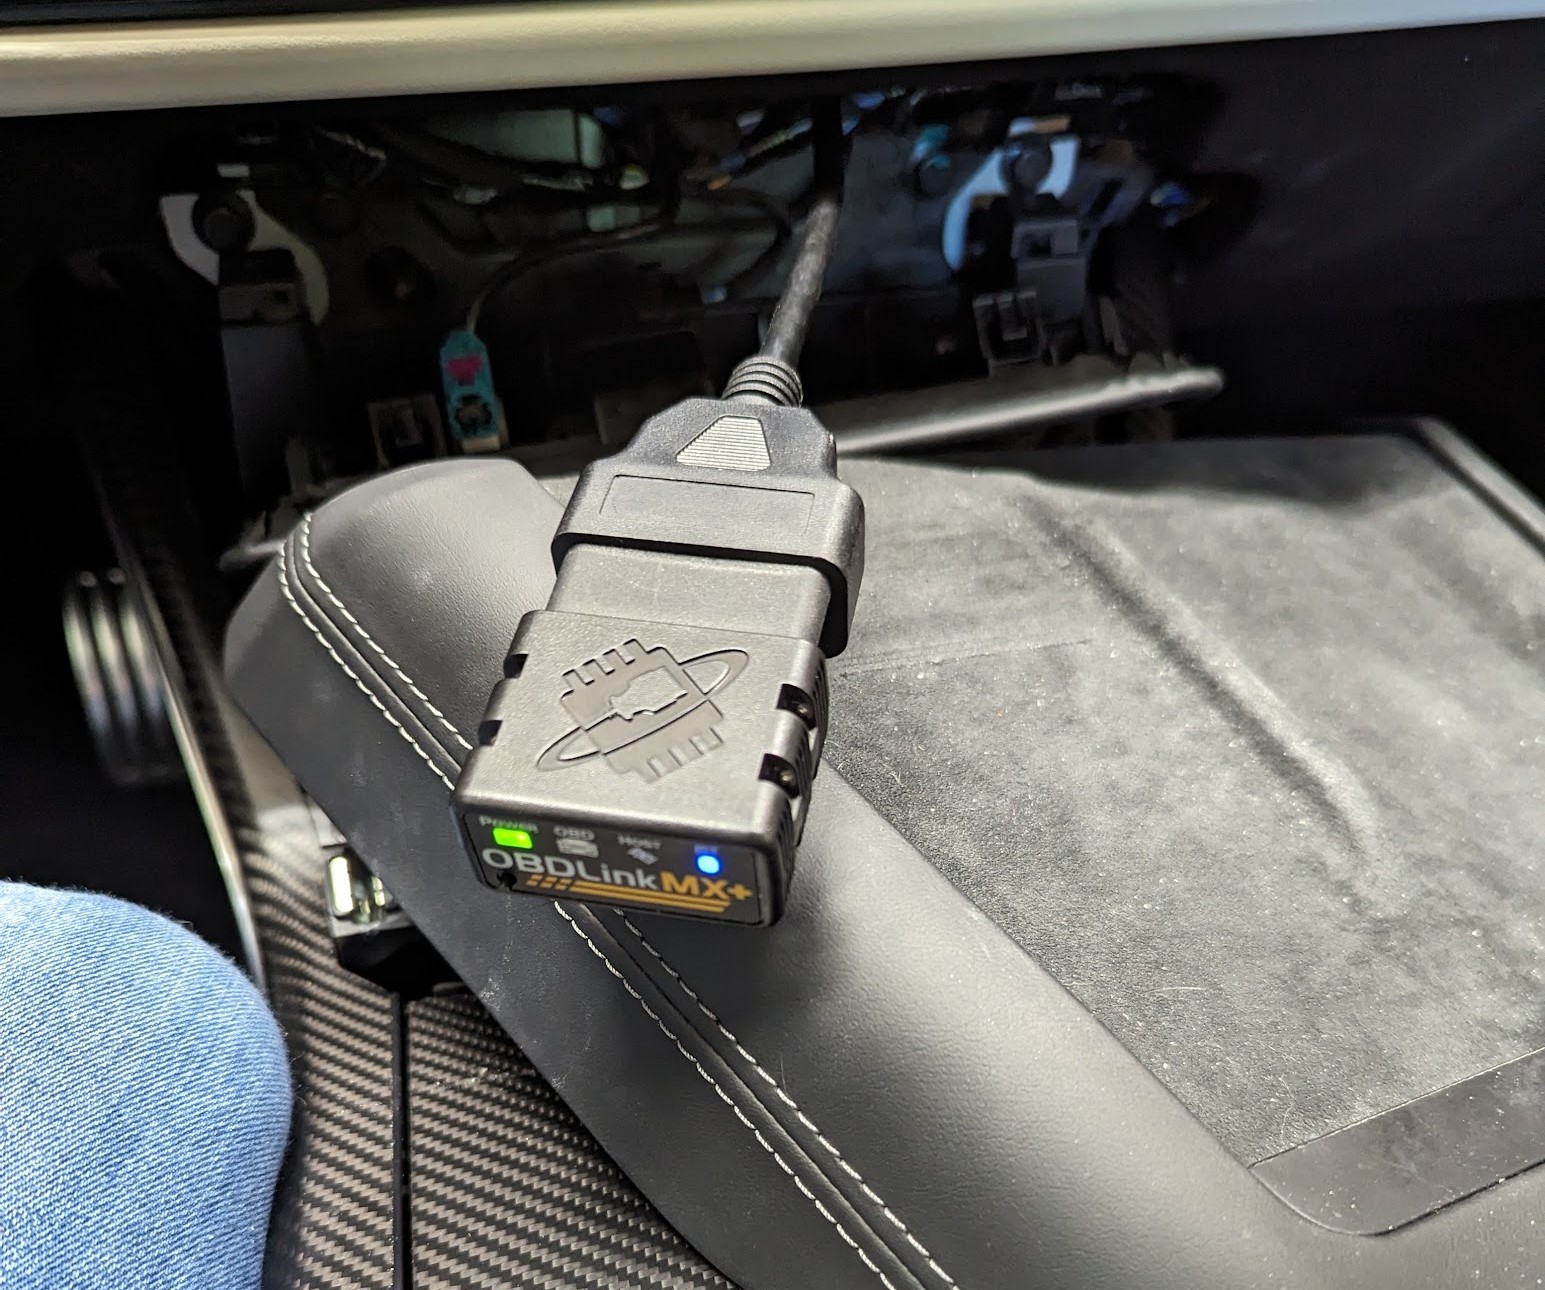
Once I upgraded to a more modern car a couple years ago, I became very curious about what data I could collect from it. I ended up creating a data pipeline to store and process video from its 4 cameras as well as vehicle telemetry (speed, acceleration, etc).
Using AI To Create A Ham Radio Answering Machine

OpenAI released a speech-to-text model called Whisper, and I decided that I wanted to use that to transcribe conversations on ham radio channels so that I could catch up on what’s been happening while my radio was turned off during the work day.
Making Pretty Graphs From Power Consumption Data
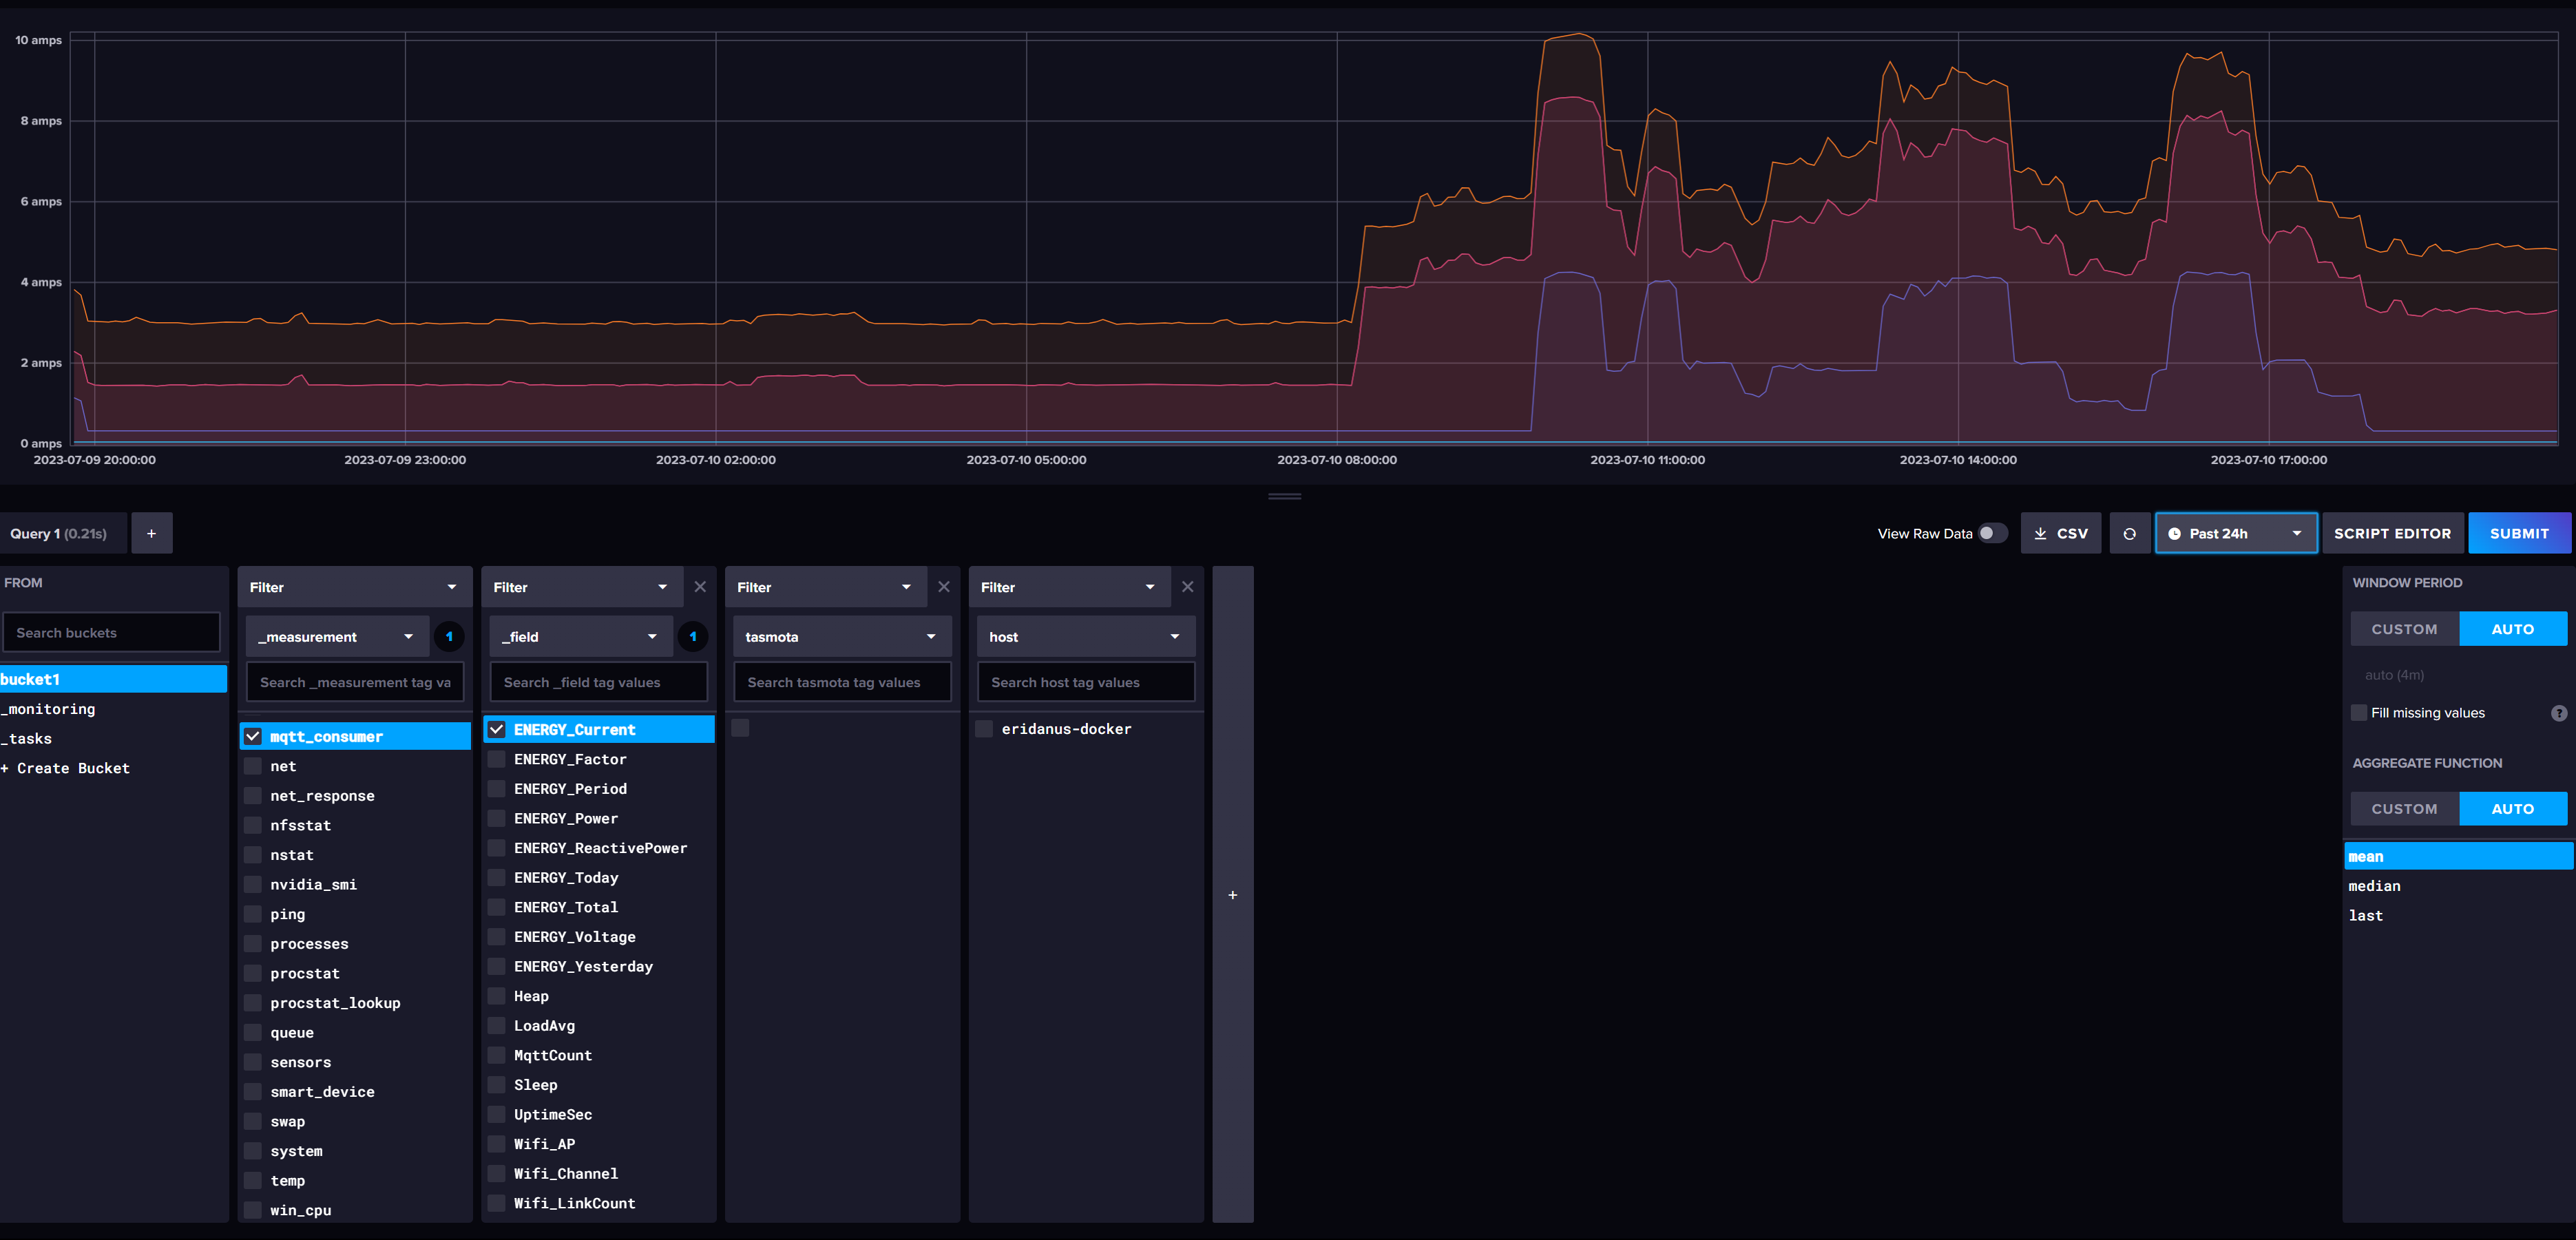
At some point I became interested in very accurately measuring the amount of power I’m consuming for all of my computer hardware. I’m regurgitating this from memory because I barely documented anything, but what follows is what I remember of this project.
To-Do List e-Ink Display
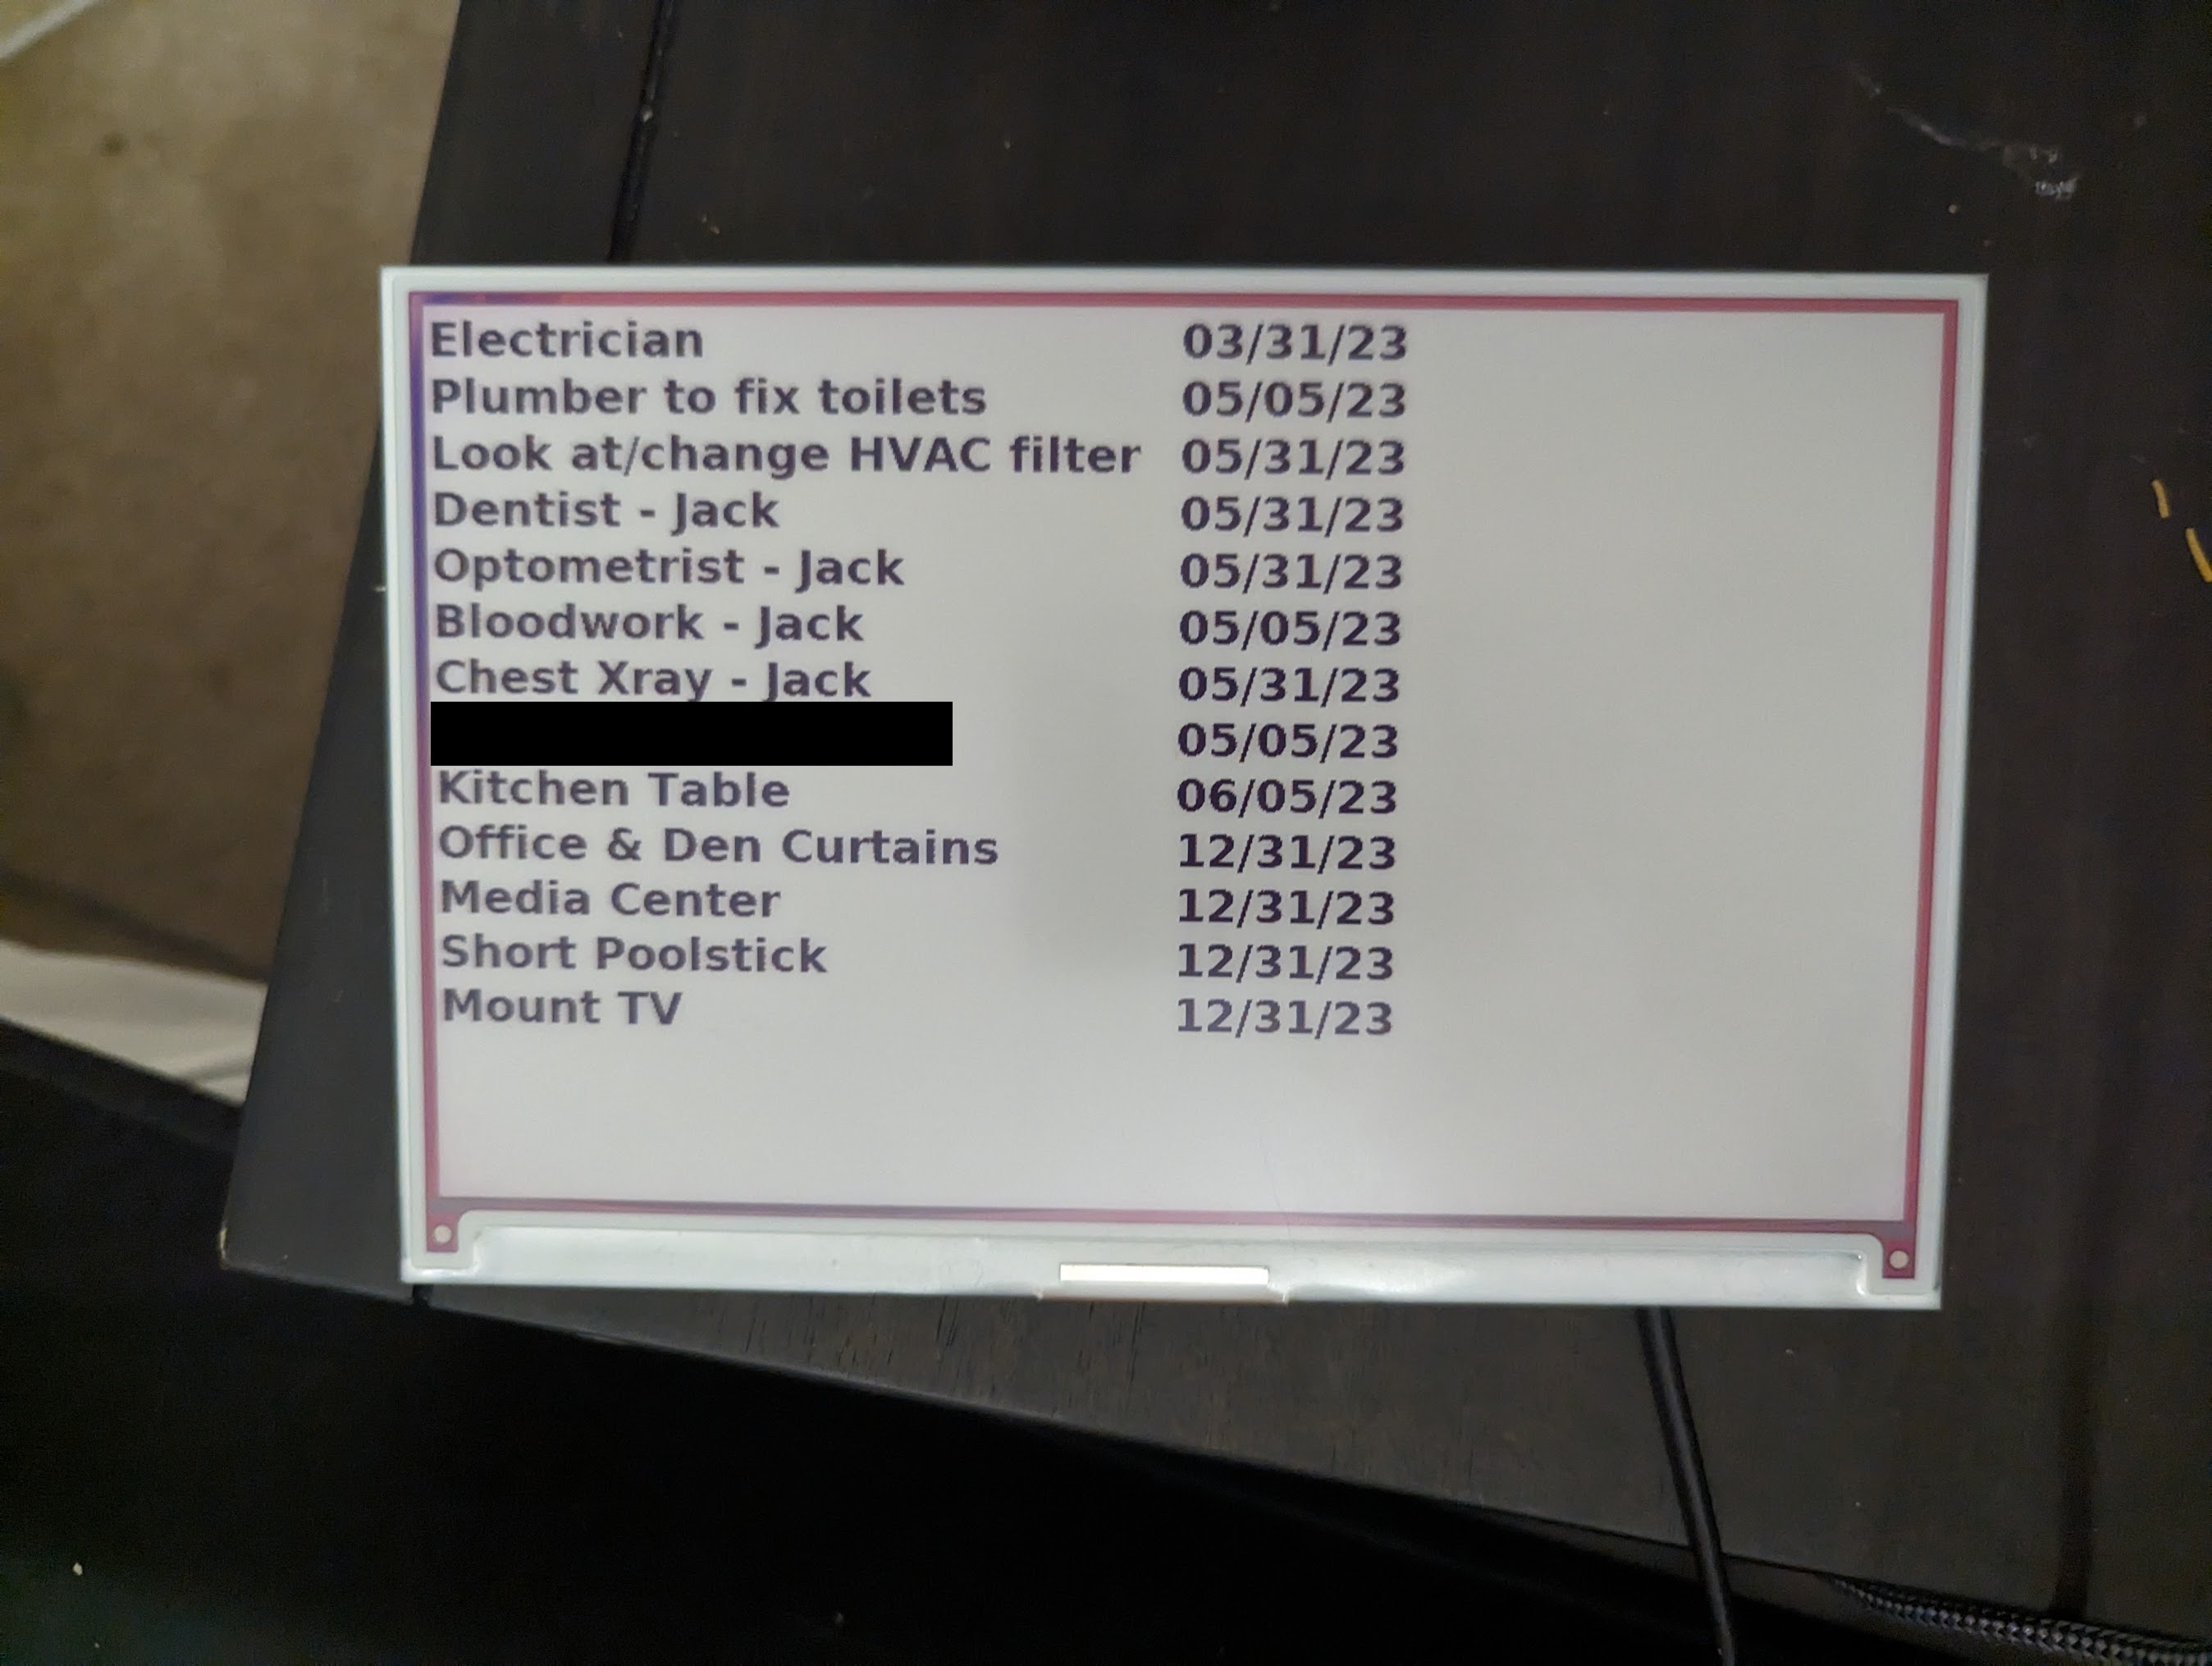
My partner and I have a to-do list that we maintain in a Google Sheet which contains basic descriptions and due dates of tasks/chores we want to get done. I wrote a very simplistic Python script that will use the Sheets API to access this list and render it on an e-ink display powered by a Raspberry Pi Zero.
Getting Pretty Pictures From Geostationary Orbit
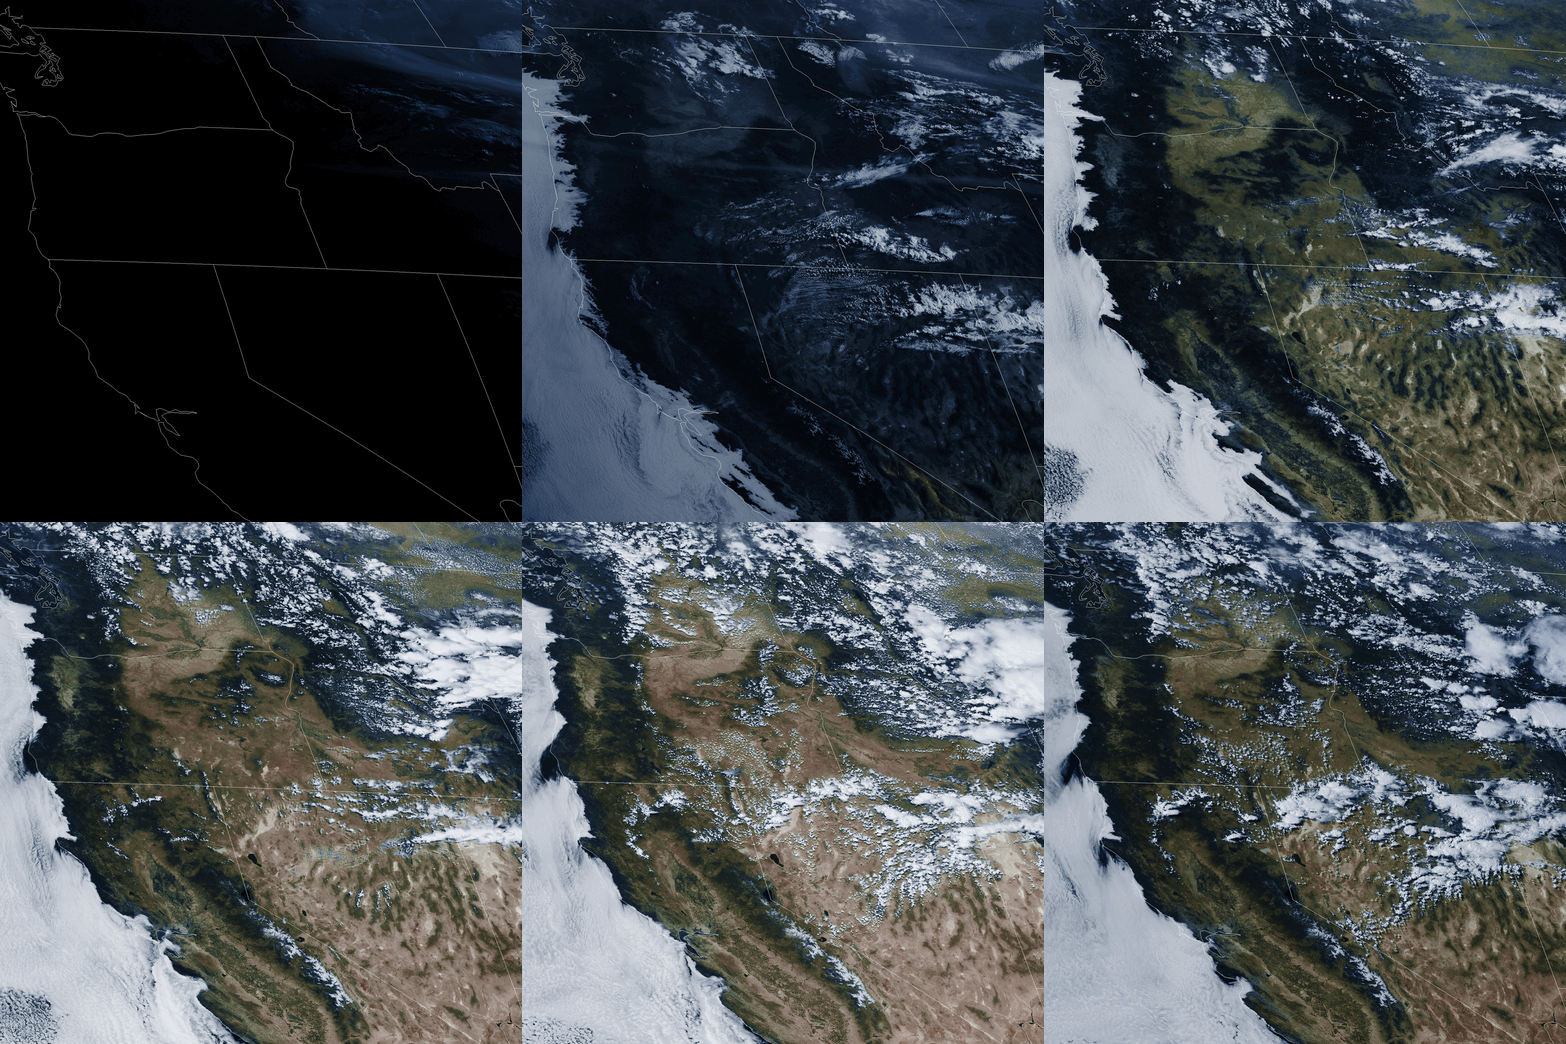
I’ve always been super interested in space, and once I started getting into radio stuff I knew I’d eventually want to receive a signal from an interesting satellite. Fortunately, my tax dollars paid for a very expensive satellite called GOES-18, which is currently in geostationary orbit above me. I managed to pull high resolution images from this satellite and wrote a script to produce gifs out of those images.
Environmental Sensing: Measure ALL The Things
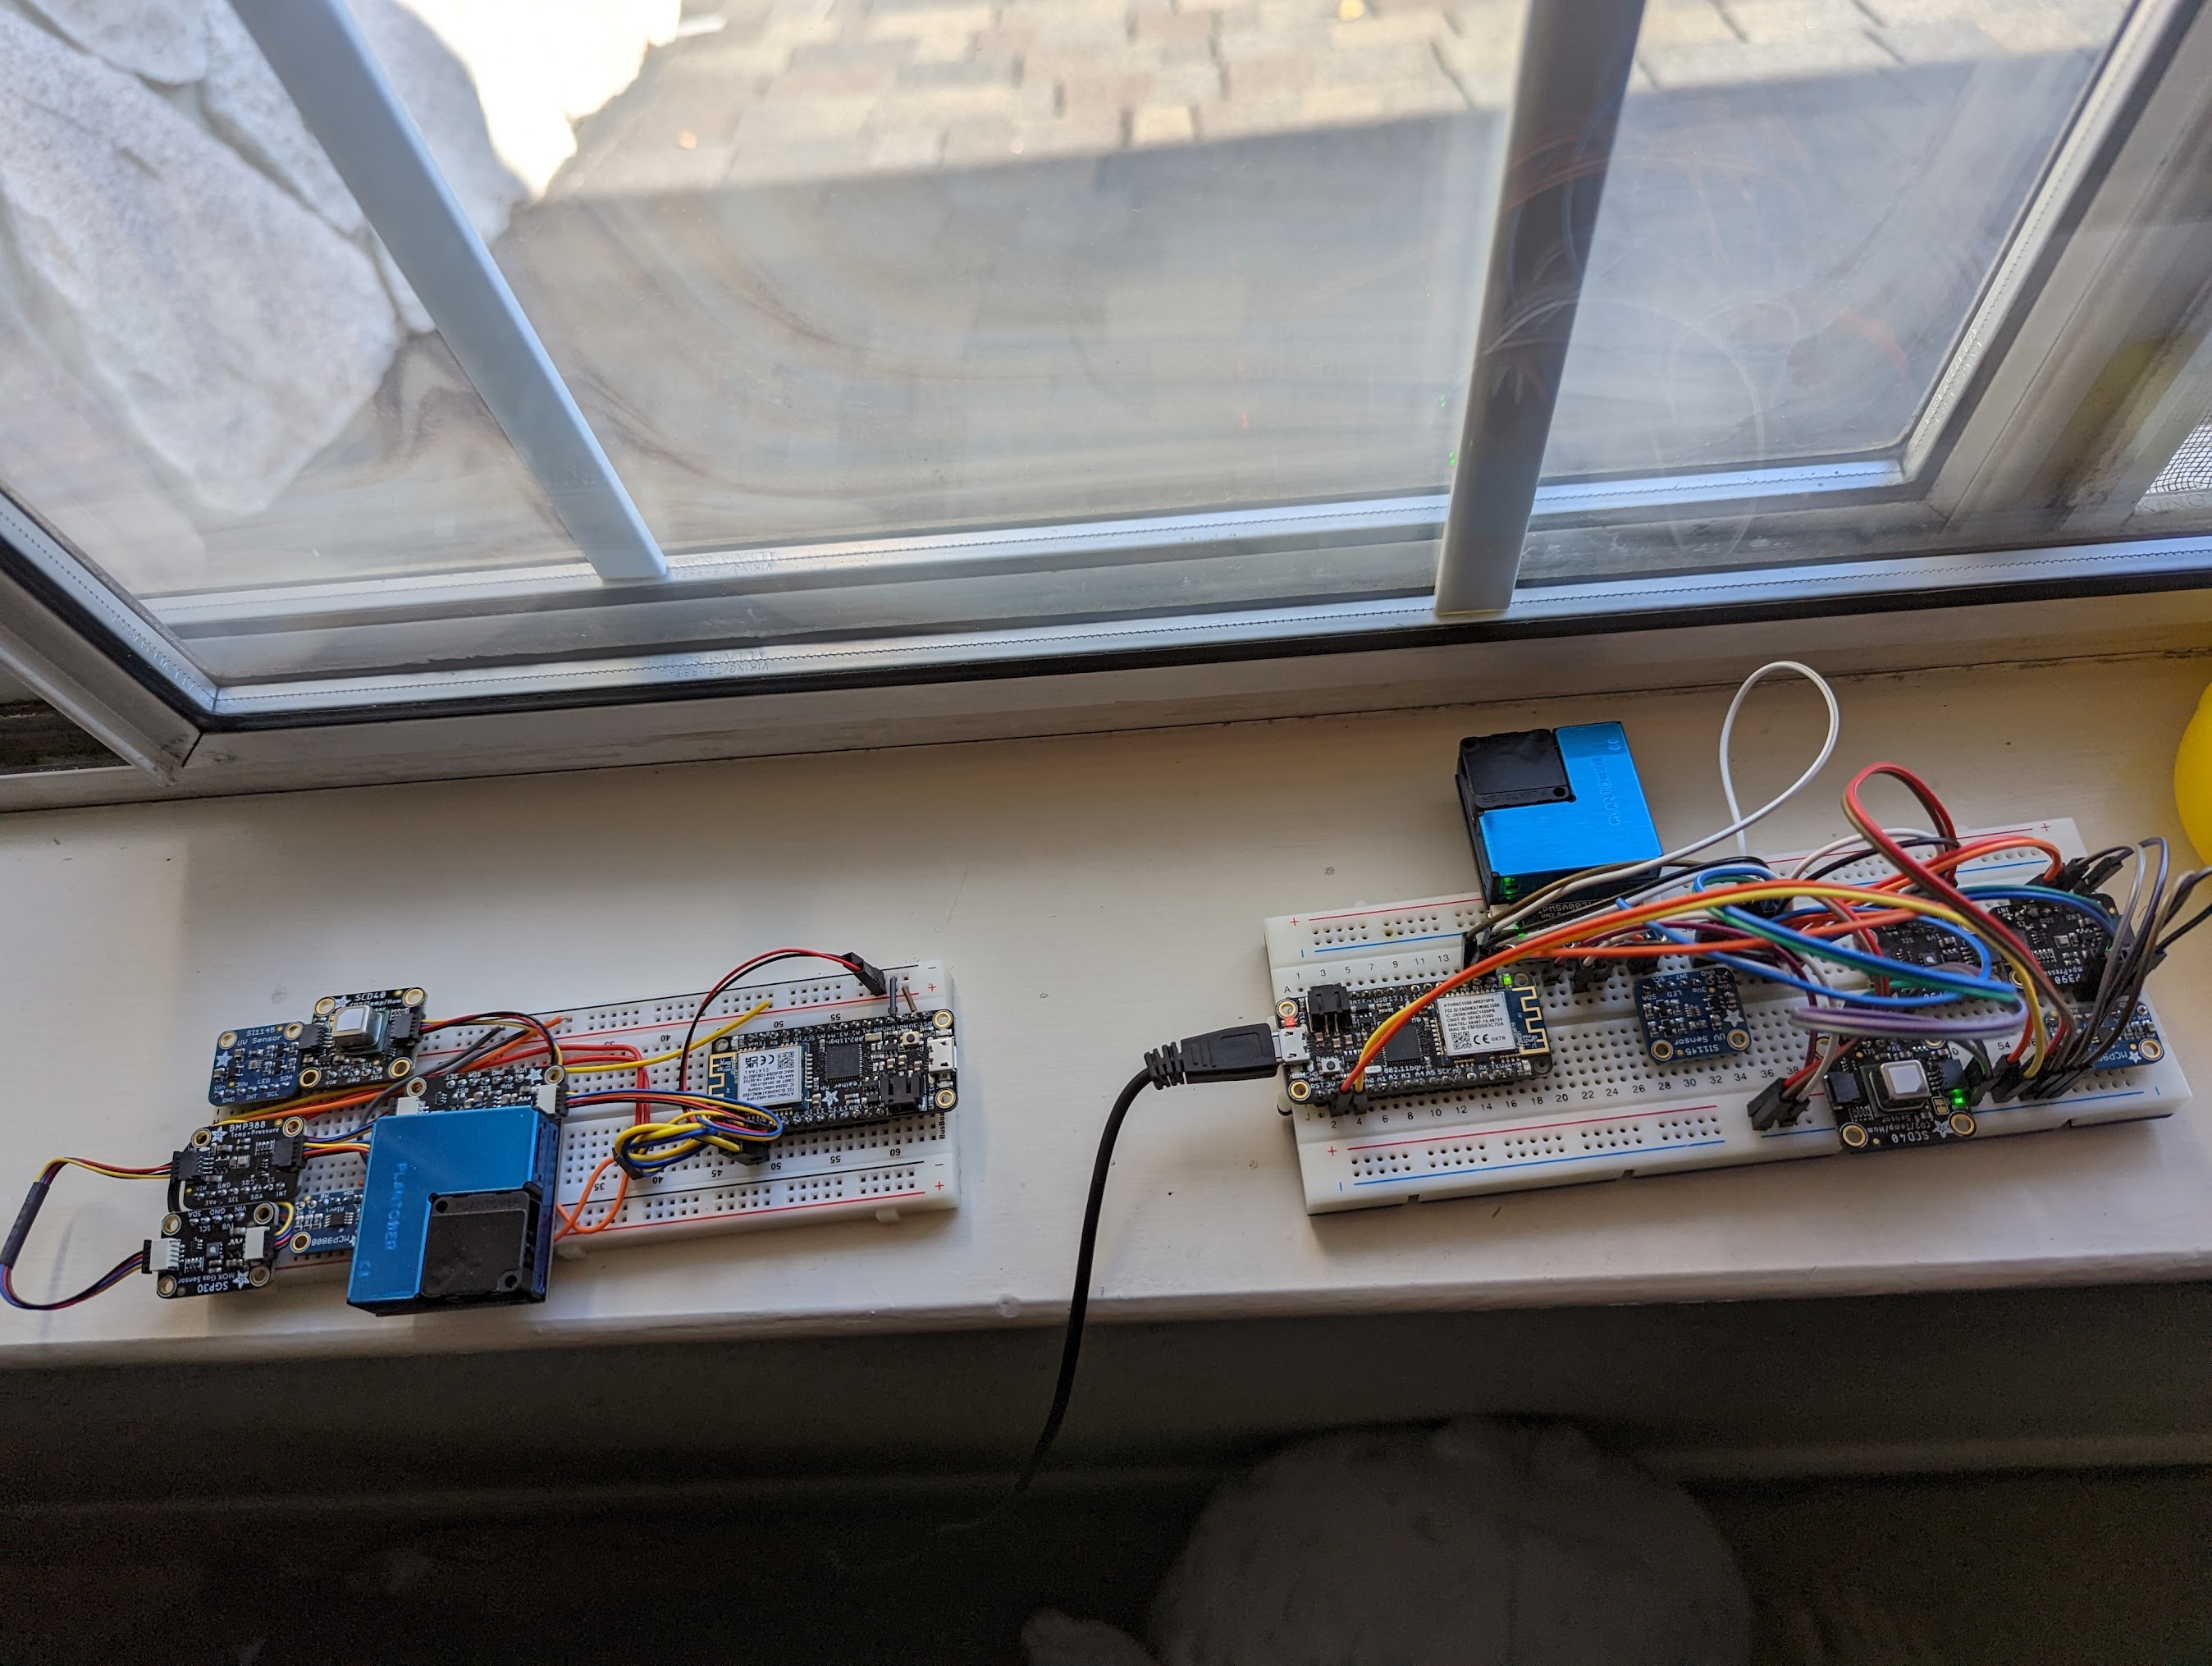
There’s something strangely comforting about removing the human element from the perception of reality, and allowing empirical digital measurements to help us understand our environment. With that in mind, I decided to put together an array of sensors and output that data to InfluxDB so that I could make more pretty graphs.