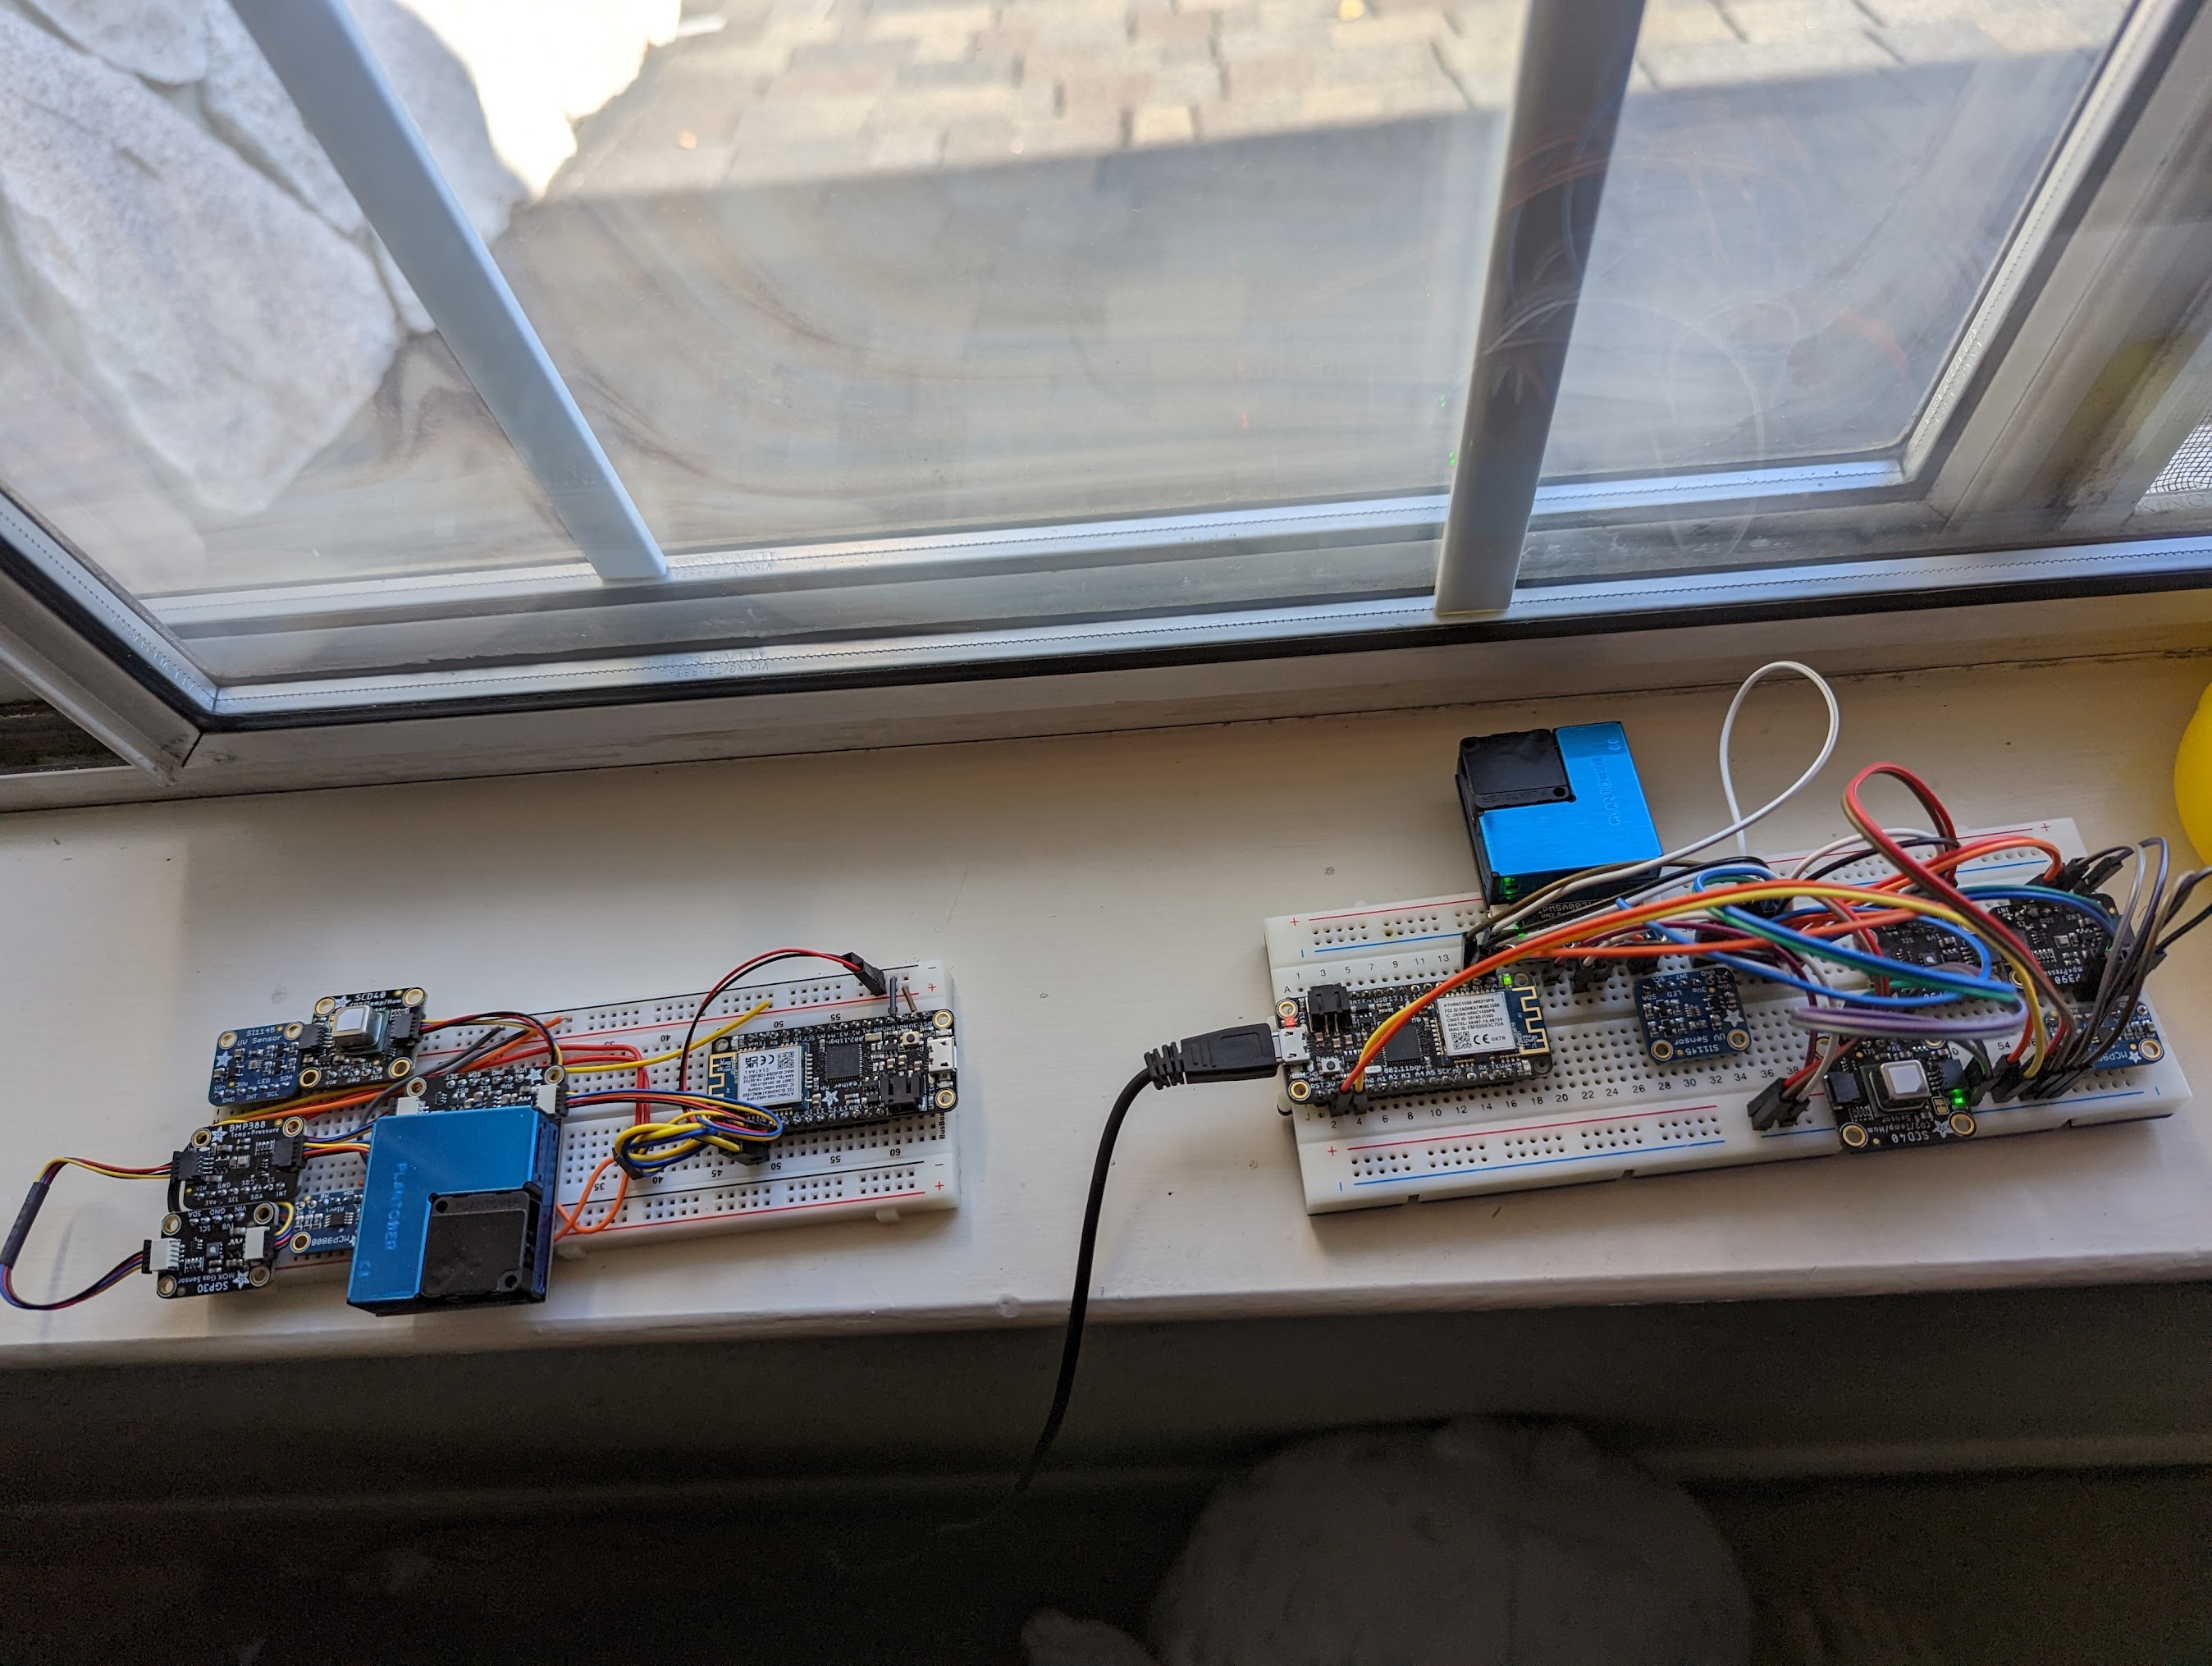
There’s something strangely comforting about removing the human element from the perception of reality, and allowing empirical digital measurements to help us understand our environment. With that in mind, I decided to put together an array of sensors and output that data to InfluxDB so that I could make more pretty graphs.
Hardware

In the above image, the device on the left was the inital prototype, the device on the right was a slightly cleaned up verison of the exact same thing.
As far as shopping goes, I literally just went to Adafruit’s online store and bought every useful sensor I could get my hands on. I got 3 of each of the following (linked are the datasheets, mostly for my own reference):
-
PMSA003I Air Quality Breakout
-
SI1145 UV/IR/Light
-
SCD-40 CO2
-
BMP390 Barometric Pressure/Temperature
-
SGP30 VOC/eCO2
-
MCP9808 High-Precision Temperature
A SAMD21 with an ATWINC1500 slapped on for WiFi served as the microprocessor to gather this data and insert it into InfluxDB. In particular I used the Feather M0 (also from Adafruit). This was chosen for a few reasons:
1.) It had WiFi with a built-in antenna
2.) It could be powered by battery
3.) It was very low power
There were plans to make an outdoor version of these that are capable of being solar-powered, but that’s morphed into a different future project using LoRa instead of WiFi.
I put these together on a breadboard out of impatience and a lack of creativity. In the future I might put them together with some sort of enclosure but I doubt I’ll ever get around to it.
Software
At the time I built this there wasn’t a functioning library that could run on the SAMD21 which would publish data to InfluxDB. As a result, I ended up writing my own very simplistic program that would construct a data point with measurements from all 6 sensors and push it to InfluxDB. The code for this project isn’t particularly interesting since it’s mostly a combination of boilerplate examples from each sensor and constructing a basic HTTP POST request to send to InfluxDB.
Ultimately I built three of these devices. I keep one in my office, one in my bedroom, and one in my living room. This leads to an interesting diversity of data. The one in my office is on the windowsill facing East so it gets direct sunlight during the daytime. The one in my bedroom is on my nightstand so it is able to measure the accumulation of CO2 while I sleep, as well as measuring how dark it is. The one in the living room is downstairs so the temperature and pressure vary from the other two sensor arrays.
I’ve been able to gleam some pretty cool insights from this dataset although the analysis thereof is probably a blog post in its own right. Instead, I’ll just post some graphs…
Pretty Graphs!


